Drive statistics
The Statistiche (statistics) page shows how your vehicle has been used over a period. Open it from the Statistiche tile on the home, or from the tab bar. ← Il mio veicolo takes you back to the home.
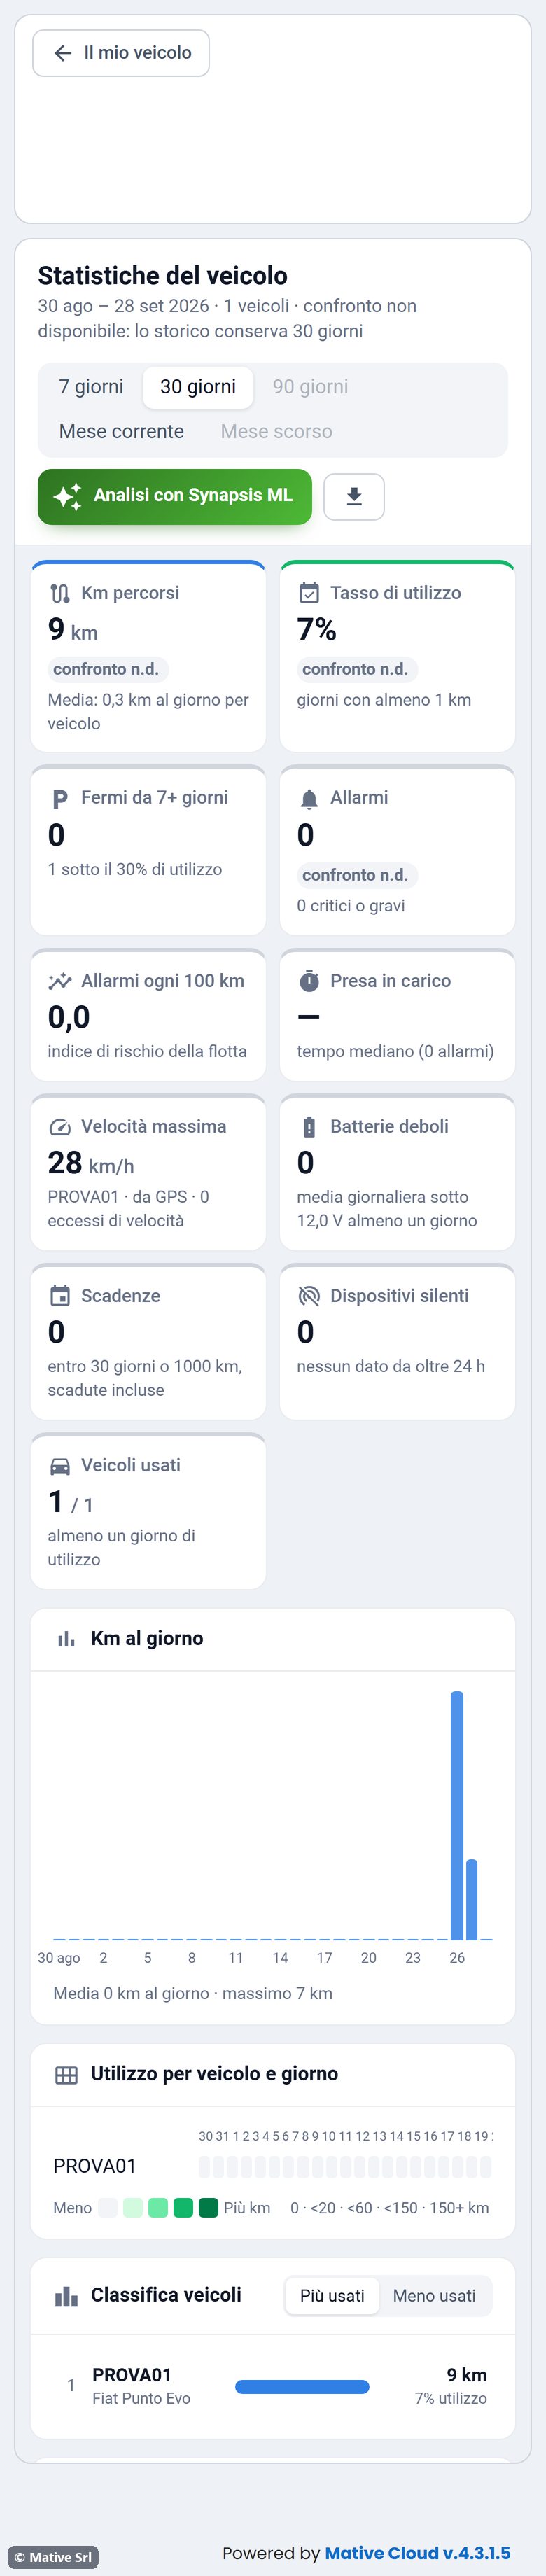
Period
Choose 7 giorni, 30 giorni, 90 giorni, Mese corrente (current month) or Mese scorso (previous month). Periods longer than the history kept by the platform are disabled. Analisi con Synapsis ML opens the Synapsis ML analysis of your vehicle's data, and the download button exports the statistics to a CSV file.
What you see
| Box | Meaning |
|---|---|
| Km percorsi | Km driven in the period and the average per day |
| Tasso di utilizzo | Share of days in which the vehicle drove at least 1 km |
| Fermi da 7+ giorni | Whether the vehicle has been stopped for 7 days or more |
| Allarmi | Alarms in the period, with how many were critical or major |
| Allarmi ogni 100 km | Alarms per 100 km driven |
| Presa in carico | Median time between an alarm and its take charge |
| Velocità massima | Highest speed in the period and its source (GPS or CAN) |
| Batterie deboli | Whether the daily average battery voltage went under 12.0 V |
| Scadenze | Deadlines within 30 days or 1,000 km, expired ones included |
| Dispositivi silenti | Whether the tracker has sent no data for more than 24 hours |
| Veicoli usati | Whether the vehicle was used in the period |
Scrolling down you find:
- Km al giorno (km per day), with the daily average and the maximum;
- Utilizzo per veicolo e giorno (usage per day): one square per day, darker the more km;
- the ranking, the alarms by type, the upcoming deadlines, the battery health, the alarms per day and the detail table, like in the fleet statistics.